Support and Resistance – Breakout Failure
Indicator for NinjaTrader® 7/8
Features
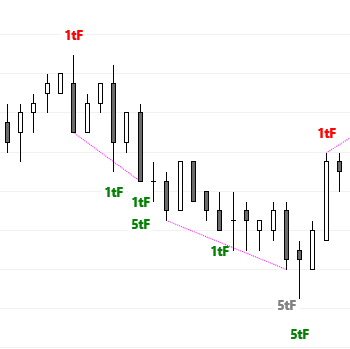
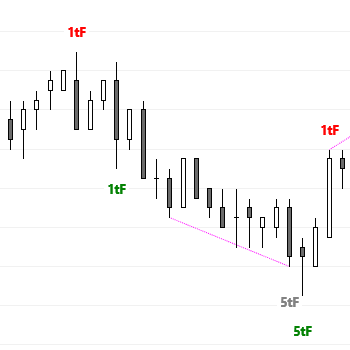
- shows Tick Failure Breakouts of possible Support and Resistance
- shows Tick Failure Breakouts above swing highs and below swing lows
- shows Tick Failure Breakouts above the high and below the low of yesterday (HOY, LOY)
- shows Tick Failure Breakouts above the high and below the low of the 1st bar of the session (useful for RTH traders who trade charts with gaps)
- configure swing strength, bars to look back and individual colors
- use as a discretionary indicator and for Automated Trading with BloodHound
- alert feature
- does not work on Renko and PointAndFigure charts
- achieves best results on futures and equities (on centralized markets, where all participants seeing the same data)
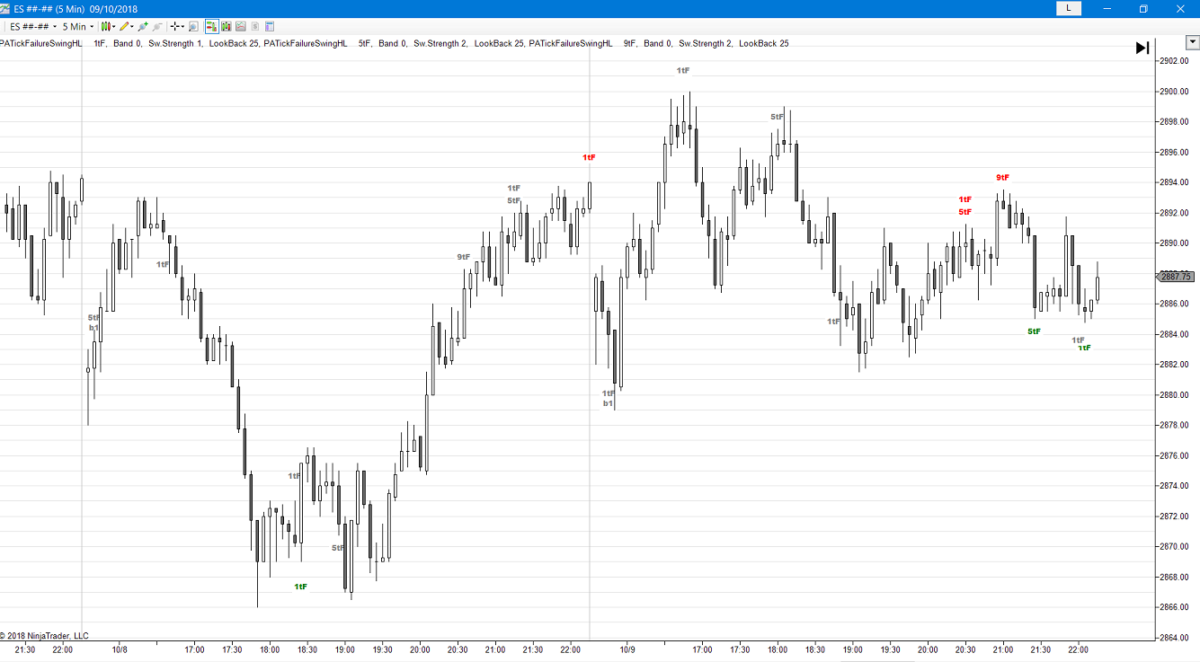
Example Charts
All of our available paid indicators are distributed in one package.
This package also includes a chart template (“PA_Indicators_ES_5min”) .
After installing the indicator package into NinjaTrader, that chart template can be
used to show a possible setup of the indicators for the ES E-mini 5 minute RTH chart.
Download For NinjaTrader 7
Download For NinjaTrader 8
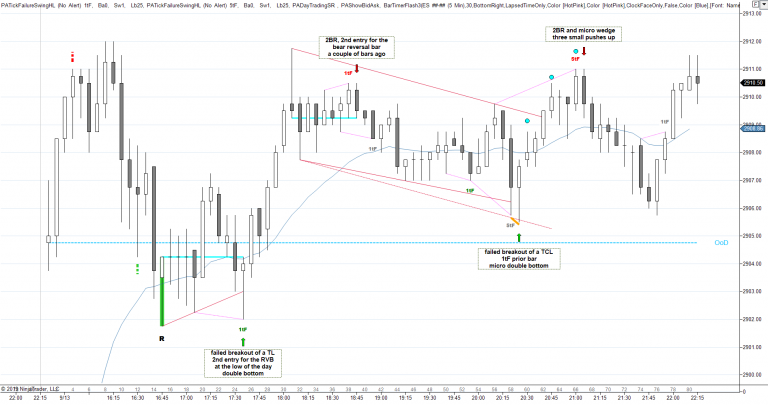
Look for confluence
Confluence is very important in trading and means to have several (at least two) reasons to take a trade. Your 1st reason is the Tick Failure Breakout and your 2nd reason can be e.g. Support / Resistance, measured moves, trend line / trend channel line overshoot, Buying/Selling Pressure, a 2nd attempt to reverse and many more.
Automated Trading
Only the NinjaTrader 8 version of the S/R Breakout Failure Tick indicator is compatible with BloodHound from SharkIndicators. You can call it as well from your own NinjaTrader indicators or strategies.
What are the settings?
The settings probably need to be tweaked especially to the “personality” and time frame of the instrument you’re trading.
If you trade the MES, load the indicator on the ES chart (the volume is much larger) and take the trades on the MES with the price from the ES contract. Sometimes the MES overshoots though.
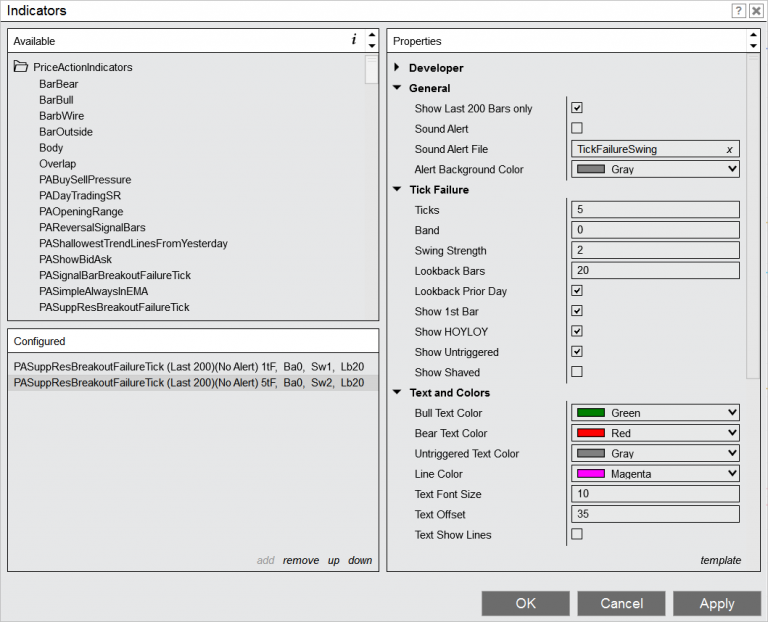
Show Last 200 Bars only
Show the indicator signals only for the last 200 bars, which will speed up a reload of the chart or indicator
Sound Alert
Play a sound and show an alert in the alert window
Sound Alert File
Pick a .WAV file from the NinjaTrader sound folder
Ticks
Extend of the Tick Failure breakout in ticks
Band
Ticks above or below Tick Failure (e.g. set “Ticks” to 100 and “Band” to 2 to show 98, 99, 100, 101 and 102 Tick Failure breakouts)
Swing Strength
Show Tick Failure breakouts only for swings with a certain swing strength
1 = one bar with a lower high to the left and right of a swing high
Look back Bars
Number of bars back to look for a swing high or low
Look back Prior Day
Show Tick Failure breakouts of swing highs or lows from prior session
Show Bar 1
Show Tick Failure breakouts above or below the 1st bar of the session (useful, if you trade charts with gaps , like RTH
Show HOY LOY
Show Tick Failure breakouts of the High or Low of Yesterday
Show Untriggered
Otherwise Tick Failure breakouts, that don’t trigger (price go beyond the other end of the bar), will be deleted
Show Shaved close bars
A shaved close bar is bar with a strong close (on the high for bull or on the low for bear) showing possible strength against a possible fade trade.
Buy Sell Pressure Indicator for NinjaTrader® 7/8
Reversal Signal Bars Indicator for NinjaTrader® 7/8
Support and Resistance – Breakout Failure Indicator for NinjaTrader® 7/8
Support and Resistance – Breakout Test Indicator for NinjaTrader® 7/8
Support and Resistance – Double Bottom / Double Top Indicator for NinjaTrader® 8 ONLY!
Get Access To Free Mt4 Indicators & Much More
Phone
+91-9958406102
Skype
intraday.trading
StockRadar.in
Telegram
Stockxperts
Inquiries
For any inquiries please email

+91-9958406102
- . Experienced .
- Specialized .
- Professional .