Support and Resistance – Breakout Test
Indicator for NinjaTrader® 7/8
Features
- Shows lines for broken Support or Resistance, that are tested by subsequent price action
- use as a discretionary indicator and for Automated Trading with BloodHound
- shows signals in real-time
- alert feature
Example Video
https://www.youtube.com/watch?v=pQd3fZYY9Lw&feature=emb_logo
All of our available paid indicators are distributed in one package.
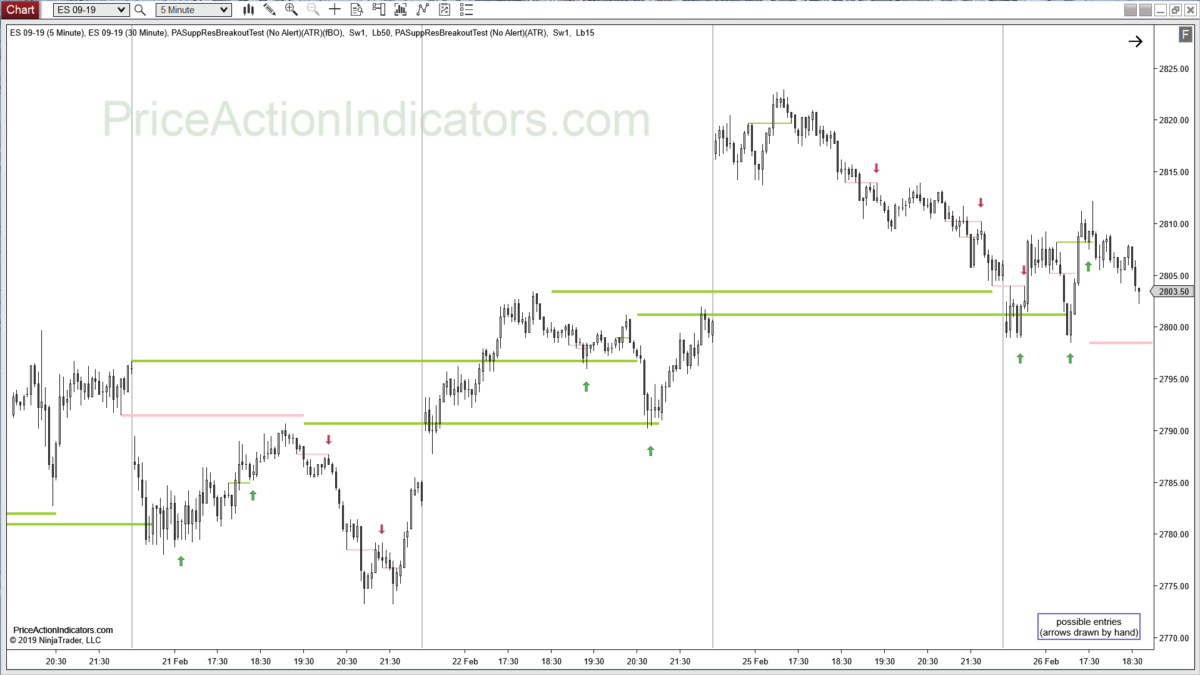
This package also includes a chart template (“PA_Indicators_ES_5min”) .
After installing the indicator package into NinjaTrader, that chart template can be
used to show a possible setup of the indicators for the ES E-mini 5 minute RTH chart.
Download For NinjaTrader 7
Download For NinjaTrader 8
What is Support and Resistance?
Support and resistance are important levels where lots of buyers and sellers are willing to trade a security. It is probably the most popular price action concept used by price action traders. If these levels are broken, market psychology shifts and new levels of support and resistance might get established. Although single lines look nice on a chart, levels need to be seen as zones.
“One of the most useful rules in trading is that if something resembles a reliable pattern, it will likely behave like the reliable pattern. In any case, nothing is ever perfect or certain, so close is usually close enough.”
A support level is a level price tends to bounce off, find support as it falls. A resistance level is a level price tends to find resistance as it rises. If price breaks through a support and resistance level it is likely to continue until approaching another support or resistance level.
Every swing point can be considered a potential support or resistance level, although major swing highs and lows hold more significance, as they are visible to higher time frame traders too. Trend lines, trend channel lines and moving averages can be support and resistance too (usually very subjective, because of all the variants one can draw them).
Role Reversal
A broken support level often becomes a new resistance level. The opposite is true; a broken resistance level often becomes a new support level.
Consider the below example for a broken support level.
The market trades back to the support level (here the low of the day). Some traders start buying, when price gets close to it and also scale-in below, in case of a failed breakout.
Despite the buying, price declines further and breaks out of the support level by a significant amount. Traders who bought at the support level and might have scaled in below to lower their average entry price, realize that they might be on the wrong side of the market and place sell orders near or at the broken support level. Early breakout traders might have been able to scalp out parts of their position and are eager to sell more as price pulls back to the former breakout point. This profit taking by early breakout traders and buying by scale in buyers creates a pull-back in the opposite direction of the breakout (the Breakout Test).
After a test of the former breakout level (the broken support) price then continues in the direction of the breakout fueled by the orders of traders, who were on the wrong side of the market and the breakout traders.
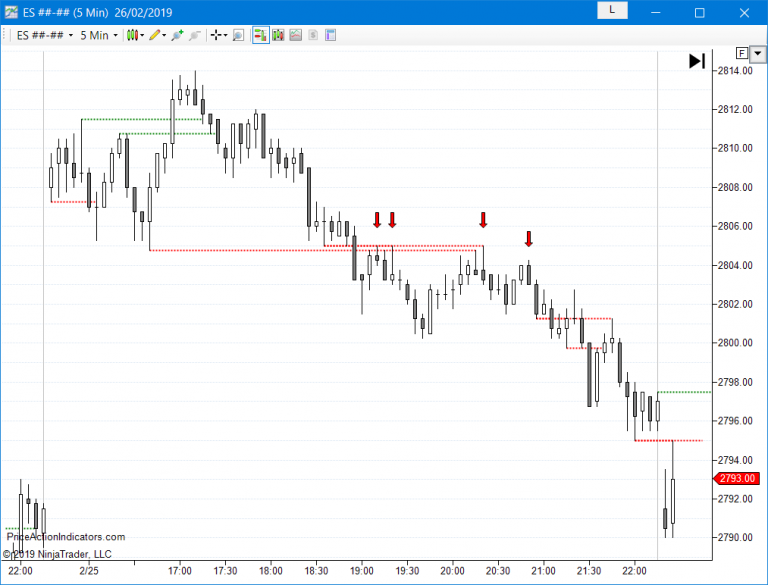
Breakout Test, Breakout Pullback
A successful breakout, that extends further in the breakout direction than a possible failed breakout, often retraces in a pull-back against the direction of the breakout. Some traders believe, that a successful Breakout Test will not pull-back past the earlier point of breakout. But, this often depends on the size of the breakout and context (trading range, trend and strength of the trend e.g. spike or a channel).
Can I simply trade every signal?
- this largely depends on context, trading style and stop loss (risk), also on your ability to scale in and the use of wide or swing stops (below the last higher low or above the last lower high in a trend)
- to increase the probability of a successful trade you can wait for a strong Reversal Signal Bar after a couple of pushes at a broken support or resistance level and trade the Breakout Test with a stop entry
- in a pullback in a trend it’s reasonable to buy/sell closes (exhaustion) near broken support or resistance levels to enter with trend
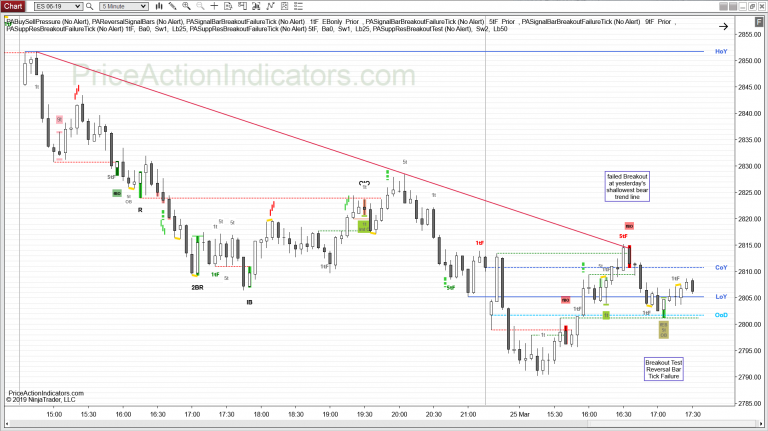
- look for confluence with signals from other indicators, e.g. Buying/Selling Pressure, Tick Failures (see below)
Multiple instances of the indicator with multiple time frames on one chart
If you want to limit the number of charts to look at you can setup a chart with multiple time frames (e.g. a higher time frame) on one panel. The higher time frame data series will be overlaid and transparent.
To use the support and resistance of the 30 min time frame on a 5 min chart you need to add a 2nd data series to that 5 min chart and set the chart style to “Line on Close” and the color to “Transparent”. The “Days to load”, “Trading hours” and “Panel” should match the 1st data series.
Then use the 30 min data series as the “Input series” for the Breakout Test indicator. Make sure to use another line style and thickness of the support/resistance lines to distinguish them from the 5 min lines
Buy Sell Pressure Indicator for NinjaTrader® 7/8
Reversal Signal Bars Indicator for NinjaTrader® 7/8
Support and Resistance – Breakout Failure Indicator for NinjaTrader® 7/8
Support and Resistance – Breakout Test Indicator for NinjaTrader® 7/8
Support and Resistance – Double Bottom / Double Top Indicator for NinjaTrader® 8 ONLY!
Get Access To Free Mt4 Indicators & Much More
Phone
+91-9958406102
Skype
intraday.trading
StockRadar.in
Telegram
Stockxperts
Inquiries
For any inquiries please email

+91-9958406102
- . Experienced .
- Specialized .
- Professional .